Drivers and Consequences of Inequality in the UK
1 Prologue
The UK’s wealth and income inequality is not a new phenomenon, even though it has attracted more attention recently. In this report, I portray the situation using various angles, open-mindedly ask the question whether the situation should be seen as a problem, comment on the drivers of the situation, and suggest some policies to alleviate it.
2 Income and Wealth Inequality in the UK
Probably the most famous and known measure of inequality is the Gini index (Galbraith 2016a). The index, introduced by Corrado Gini in 1907 (Gini 1997), measures the average income discrepancies between every pair of individuals in an economy on the scale of the average income in that economy. The index ranges from 0 to 1, or equivalently, 0 to 100%, with 0 being the measure of a totally egalitarian society. For the UK, there are multiple estimates of such an index, and one is presented in Figure 1 using the SWIID dataset (Solt 2020):
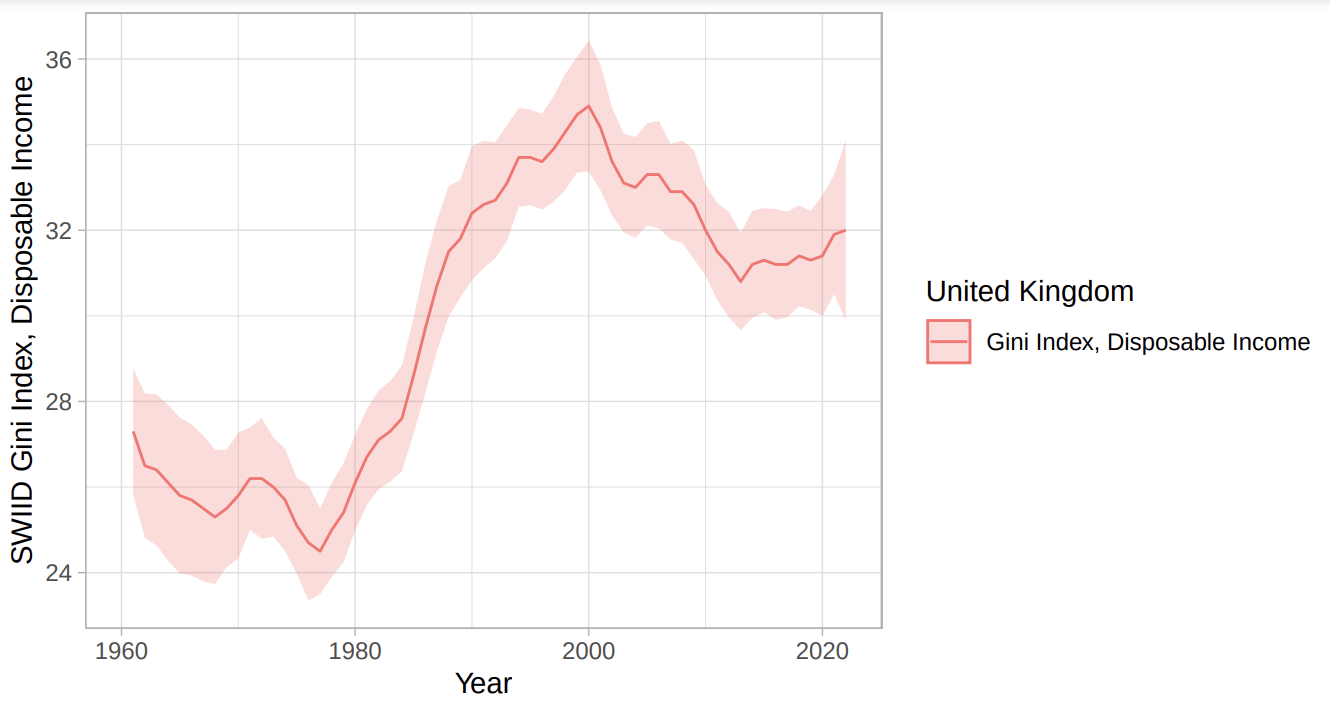
While the solid line represents the best guess about the Gini coefficient, the ribbons present a confidence interval, i.e., a range in which we find the true value of the Gini coefficient with high confidence.
The term income here means all the earnings of a household, whether they come from labor, capital, or rent. Disposable income is the income after governmental benefits and deducted taxes. Therefore, this is the income at hand for an average household.
It is useful to have a look at another measure of income named market income, which is the total income of a household coming from the market, i.e., labor, financial assets, and rent, before any direct influence by the state in the form of subsidies. (Galbraith 2016b)
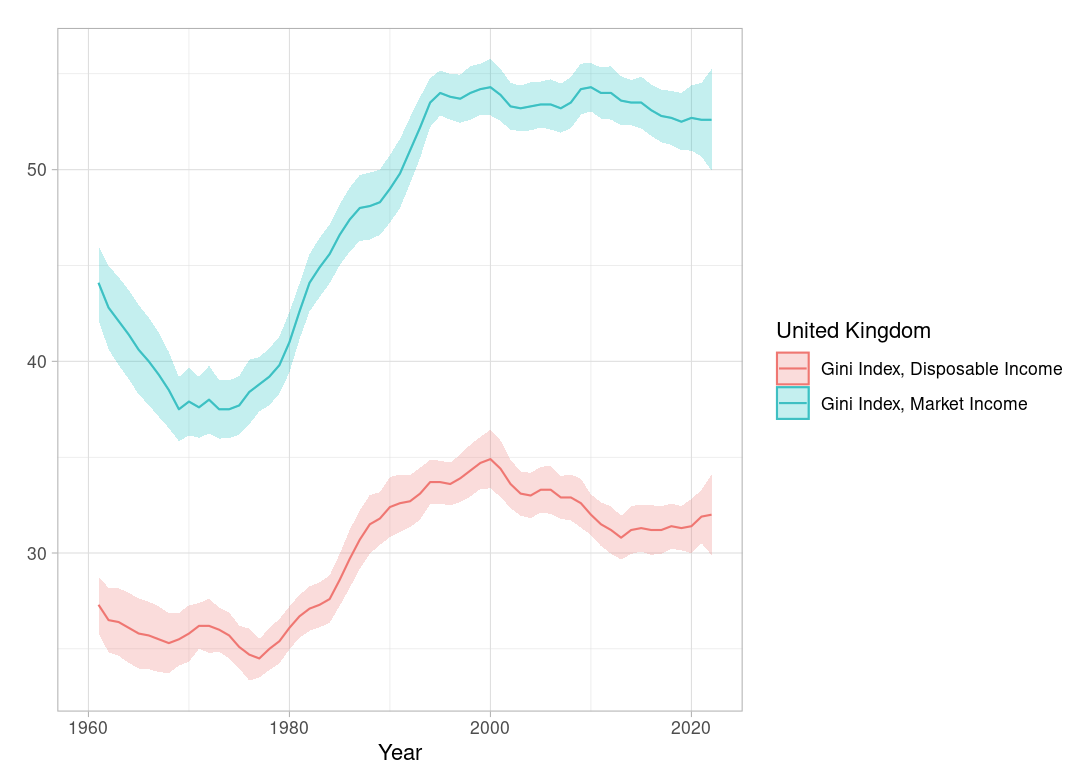
In either case, the patterns are more or less similar: a decrease in inequality from the 1960s to the late 1970s, a sharp increase in the measure from the 1980s to the early 2000s, and then a relative decline in the indicator.
The Gini coefficient, like all single indices that aspire to capture the behavior of a complex system, is easy to use at the cost of losing information. Therefore, it is very important to look at the system in detail to retrieve some of the lost information and augment our big picture. Figure 3 presents the inequality situation by the share of income captured by each fifth of UK society.
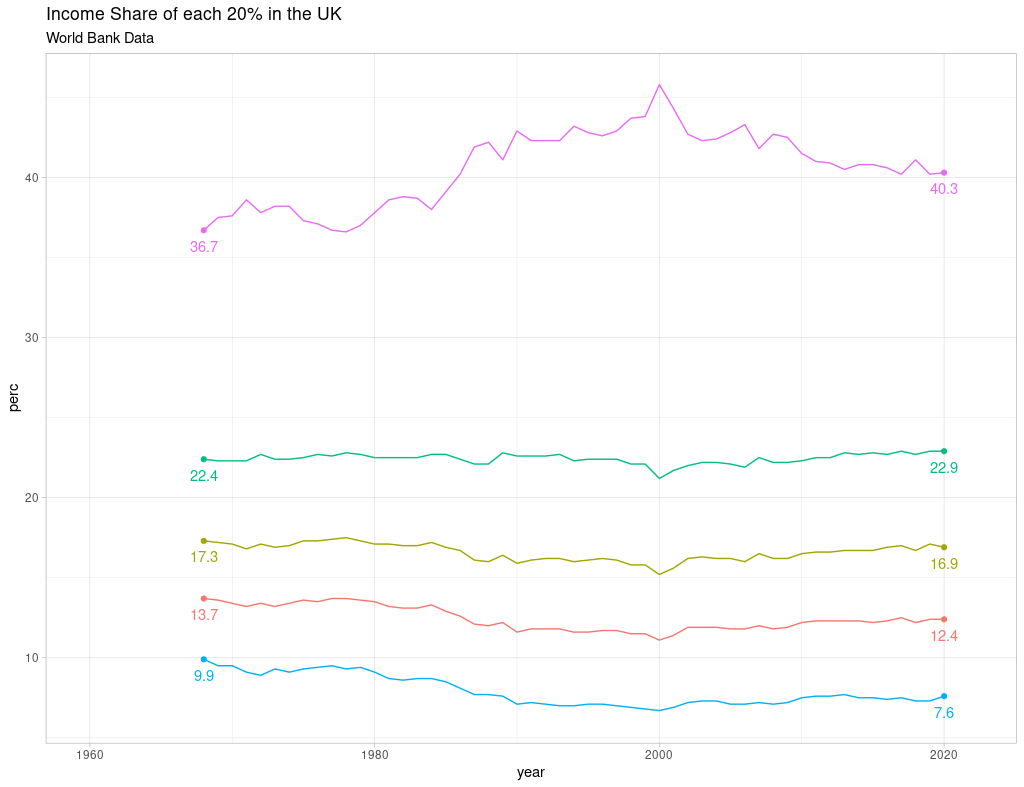
Figure 3, created using the World Bank Data via the R WDI package (Arel-Bundock 2022), portrays the income inequality situation in the UK in more detail. We can now see that over the last 50 years or so, the income share of the poorest fifths, the 1st, 2nd, and even 3rd fifths, has shrunk in favor of the 4th and especially the top 20% of society. In other words, considering the overall increase in wealth generation, fewer and fewer chunks have been allocated to the bottom 60% of the economy.
We can also learn further about the relative drop in inequality measures in the last decade by filtering the data:
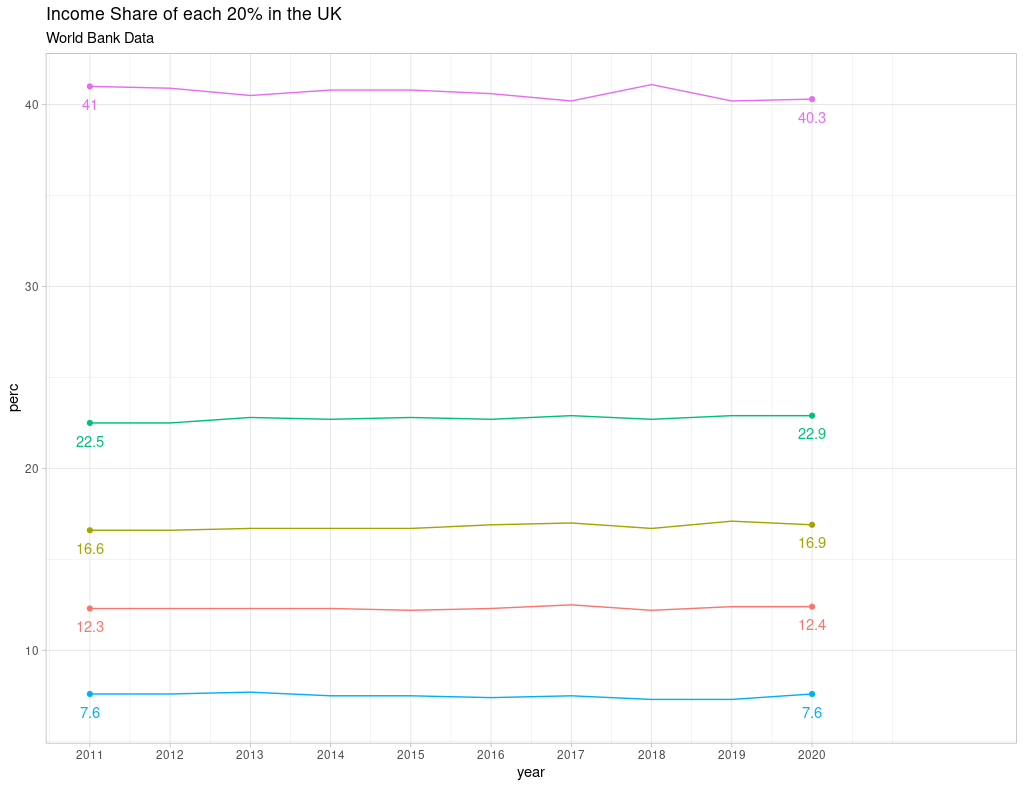
As Figure 4 demonstrates, the bottom fifths, especially the 1st 20% of the income distribution, have earned nothing from the relative reduction of the highest fifth’s income share, even though this poorest fifth was the most in need.
It is possible to go further into the details by looking at the situation from different angles, i.e., by incorporating new variables.
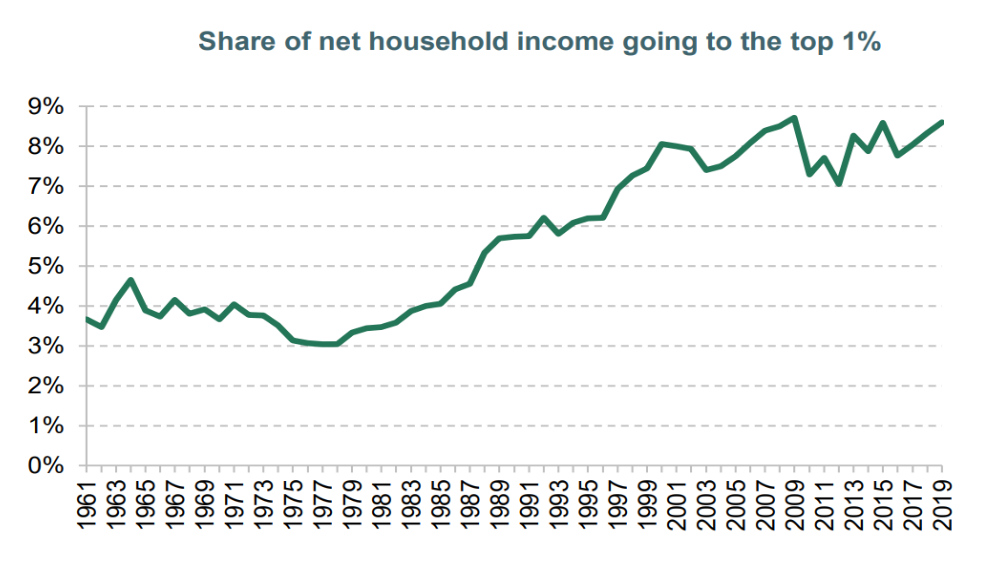
By even further zooming in, we discover that even though some evidence shows a reduction in the income share of the top 20%, the top 1% have been accumulating wealth without any reduction in the flow. Figure 5, extracted from a 2023 House of Commons Income Inequality Briefing(n.d.), is the source of such a conclusion.
It is possible to further investigate the current state and the trends of the system to gain further insight. For instance, the income inequality in different age groups shows different behaviors. Figure 6, generated by LIS-DART, highlights that the inequality among children is on a par with the inequality among adults in the UK, while the senior citizens are more equal income-wise.

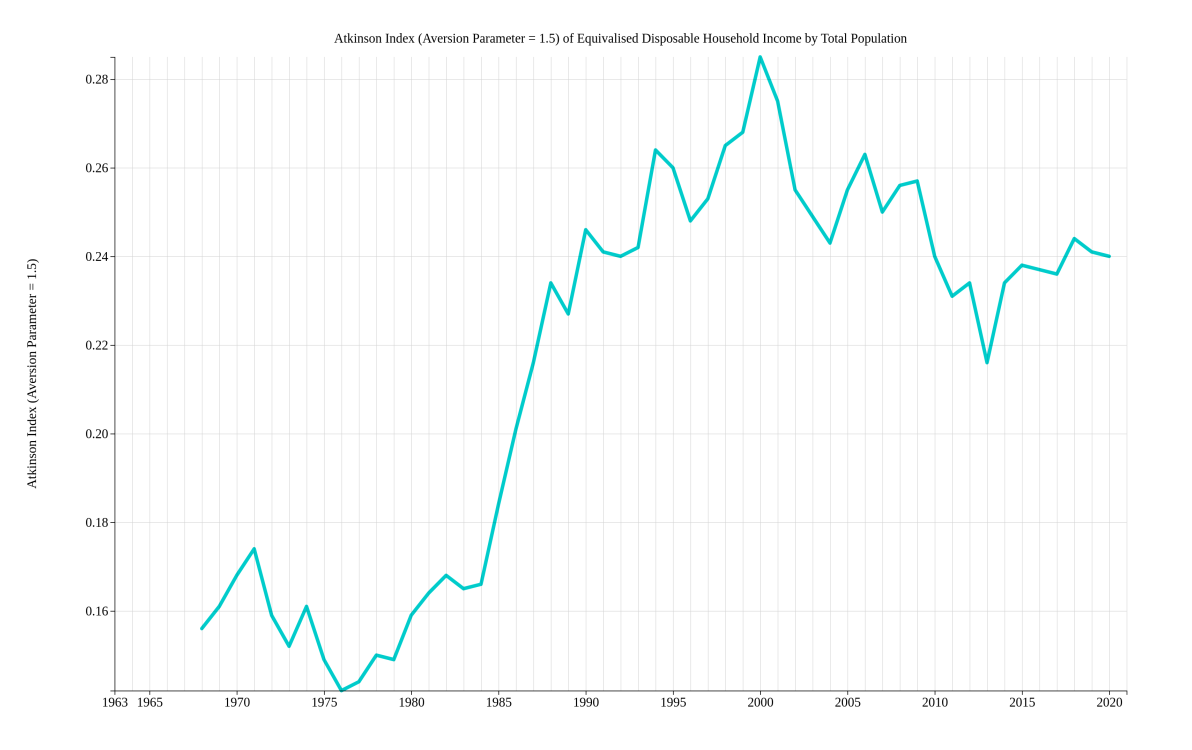
Other inequality indices tell the same story. For instance, look at the Atkinson’s inequality index(Atkinson et al. 1970) is presented in figure 7, downloaded from LIS-DART.
3 Income Inequality: A problem?
While in most recent reports, it is assumed that income inequality is a problem, I believe that we need to address this question over and over without taking its answer for granted. The reason lies in the fact that many voices, especially heard from the media and social media, present inequality as a natural state, a feature that is not necessarily bad or unfair, an incentive for people to work harder, and thus any effort to reduce it will be framed as an attack on the merit and competence of the rich out of jealousy.
Under such an impression, ordinary people might not see the situation as a problem. Milner (Milner 2021) writes:
There is some evidence that the public does not understand the extent of inequality and that they may not care that much even if they do know it.
Without constantly addressing whether income inequality is a problem, ordinary people might ask, “Why should we care about the rich when we have our own immediate needs to be met?” (Kennedy 2019)
In the rest of this section, I will review a few political, social, and economic consequences of inequality.
3.1 Inequality and Democracy
There are several ways to capture and control governments, and one is by controlling the media in order to control what ordinary people believe. Inequality and the concentration of wealth in the hands of a few have made controlling the media possible. It is estimated that:
three billionaire families control nearly 70% of the national newspaper industry. An analysis by the Press Gazette has revealed that the Murdochs, Barclays, and Rothermers control 68% of the UK national press. (Dourou 2020)
According to another estimation:
media ownership is increasingly becoming concentrated in the hands of a few, which has been exacerbated by the COVID-19 pandemic. A report by the Media Reform Coalition found that in 2021, 90% of national newspapers in the UK would be owned by only three companies. (Meckel 2021)
The Media Reform Coalition concludes that “concentrated ownership is a significant problem for any modern democracy.” (“Media Reform Coalition” 2021)
In addition to controlling the media, the rich influence the political parties through their donations. A recent study by the CAGE Research Center at the University of Warwick (“Almost Half of UK Political Donations Come from Private Wealthy ’Super-Donors’, New Research Finds” 2022) “reveals the growing influence of wealthy individuals in political affairs, particularly in the affairs of the Conservative party.” They represent the shocking results:
“The data reveals that donations have almost trebled over the period, rising from £41 million in 2001 to £101 million in 2019. Individual giving has also risen substantially, with 60% of donations in 2019 coming from private individuals.”
“Almost half of donations received in 2019 (45.4%) came from private individual ‘super-donors’, who gave at least £100,000 in a single year. In 2017, they made up only 30.8% of total donations.”
Besides the media and political parties, the association between income inequality and other aspects of democracy and democratic political processes has been studied. For instance, (Soci, Maccagnan, and Mantovani 2015) find that the higher the income inequality, no matter how it is measured, impacts negatively on citizens’ satisfaction with democracy. According to Mahmutefendic (Mahmutefendic (2021)), the level of inequality and the level of democracy are inherently correlated.
(Sch"afer and Schwander 2019) studies the turnout rates and participation gap between rich and poor. They study the relationship between inequality and participation and find that inequality suppresses voting turnout among the poor. They argue that as the poor learn from experience that the system is biased against them, they give up on participating
3.2 Inequality and Political Instability
The world has seen a recent rise in right-wing extremism. Such a rise and its possible association with income inequality have been the topic of some studies.
(Han 2016) finds evidence on the motivation of the poor by income inequality to vote for right-wing popularists, while the exact same reason discourages the rich from doing so. According to (Proaño, Peña, and Saalfeld 2022), “both income inequality as well as the bottom 10% income share are statistically linked to the recent success of the far-right parties.” The results from (Gu and Wang 2022) support this argument that the widening gap between the richest and poorest is closely tied to the emergence of political polarization.
Even though such studies are mostly associative, i.e., non-causal, the piling up of evidence and the graveness of the issue demand further caution.
3.3 Inequality and Productivity
The association between income inequality and productivity has attracted attention from some researchers. We know from the data that the output per hour of labor in the UK’s economy has been growing slowly at a dissatisfying pace. There are some evidence-based arguments in support of the hypothesis that higher inequality suppresses productivity through different channels. (Arestis 2021) For instance, the psychological effect of inequality on the workers, the demotivating low income share of the workers, the lack of enough education due to the lack of disposable income, the migration of productive labor to higher-income sectors, weakened labor unions and thus a lack of labor voice at the workplace, and imposed insecure employment terms on the workers due to inequal bargaining power might be a few of such channels.
According to a briefing of the Parliament of Australia:
At a microeconomic level, inequality increases ill health and health spending and reduces the educational performance of the poor. These two factors lead to a reduction in the productive potential of the work force. (Holmes 2016)
3.4 Inequality and Crime
It can be imagined that inequality, through the alienation channel, can positively influence the crime rate. There is some evidence supporting this hypothesis; for instance, (Anser et al. 2020) concludes that GINI and unemployment rates are the main predictors that have a devastating impact on increasing crime rate. According to (Coccia 2017), income inequality is a driver of violent crime, such as intentional homicide, but not other crime types or crime in general (Kim, Seo, and Hong 2020). (Stucky, Payton, and Ottensmann 2016) study the association from a micro perspective and conclude that local and nearby income inequality affect crime
3.5 Inequality and Growth
Probably the most important association for the majority of the public is the relationship between inequality and growth. These two are often presented as competing choices by right-wing politicians: we have to forgive growth if we want to lower inequality. They conclude that growth matters, not inequality, at least for now.
Nevertheless, there is almost a consensus on the fact that inequality slows down economic growth, at least in the medium term. From the 2014 OECD report, we read: “New OECD research shows that when income inequality rises, economic growth falls.”
Why?
“One reason is that poorer members of society are less able to invest in their education.”
(Stiglitz 2012), supporting the hypothesis of the adverse effect of inequality on economic growth, finds the reason in the weaker demand and lower spending of an unequal society due to the accumulation of wealth in the hands of a few who cannot and do not want to fill the spending gap.
According to (Ostry 2015), the duration of the growth period is closely associated with equality in income distribution. Similarly, (A. G. Berg and Ostry 2017) finds evidence that “longer growth spells—periods of strong, healthy, per capita growth—are robustly associated with more equality in the income distribution.” Likewise, according to (A. Berg et al. 2018), “lower net inequality is robustly correlated with faster and more durable growth” and “inequality seems to affect growth through human capital accumulation and fertility channels.”
Let’s conclude with the IMF’s 2015 managing director: “If you want to see more durable growth, you need to generate more equitable growth.” (Lagarde 2015)
3.6 Inequality and Health
The inverse association between income inequality and health has been supported by many studies, e.g., (Karlsson et al. 2010). The adverse effect of income inequality on the health of the lower income groups might be due to the lack of disposable income for health checks, for a healthy diet and lifestyle, or due to the long or stressful hours of working under insecure contracts. However, the health issues are not limited to the poor; the rich are also negatively affected due to fear of crime, according to (Vauclair and Bratanova 2017)
3.7 Inequality and Climate Change
Income inequality probably affects climate change through different channels, including but not limited to consumption habits.
(Green and Healy 2022) states that wealthy people’s consumption causes more emissions than the poor’s:
“emissions of the richest 10% of the world’s population were estimated to account for nearly half of global carbon dioxide emissions in 2015, while other studies put the figure at between 36% and 47% of emissions.”
Subsequently, it can be envisaged that the poor also use less-climate-friendly means, such as diesel vehicles, because of their inability to spend more on the newer and more efficient ones.
4 Drivers of Inequality
What drives inequality? There is no single comprehensive answer that inspires various policies. (Nolan, Richiardi, and Valenzuela 2019) states that “the diagnosis of the forces driving inequality upwards and their relative importance remain hotly contested”. Yet, through the literature, we can find a general consensus. In this section, I review a few of the causes explained in the literature and add my perspective to them. The following list is ordered.
4.1 Technolgy
Technology advancement is one of the reasons often cited as a driver of inequality. An IMF staff discussion note, (Dabla-Norris et al. 2015), reflects this common belief that technological advancements work against low-skilled labor since firms need them less than before, therefore their salaries drop, via supply-and-demand determination. The report also presents the idea of the ever-more important role of capital in labor in the age of automation, which translates into a lower share of labor from capital. The note’s empirical study of the potential explanatory variables of inequality suggests that technology is positively associated with inequality, especially in developing countries.
(Nolan, Richiardi, and Valenzuela 2019) argue that while technological advancements have a positive effect on inequality, this effect is mediated by other factors and is not an inevitable outcome:
These two factors Together [endogenity of technology and incentives] means higher inequality is not an unconditional outcome of technological progress but one that is shaped through institutions and policies.
4.2 Globalization
Globalization is a multi-aspect phenomenon, including but not limited to trade, financial, production relocation, technology, and political aspects. These aspects might have different and opposite effects on income inequality. (Förster and Tóth 2015) There is some empirical evidence in support of the positive effect of globalization in general on inequality, especially in advanced economies. (Dabla-Norris et al. 2015)
4.3 Financialization
According to (Palley and Palley 2013): “Financialization is a process whereby financial markets, financial institutions, and Financial elites gain greater influence over economic policy and economic outcomes.” And one major consequence of fictionalization is increased income inequality.
(Lapavitsas 2009) sees the benefits of the working class and financial institutions as mutually exclusive:
Financial institutions have sought new sources of profitability in financial expropriation and investment banking. Meanwhile, workers have been increasingly drawn into the realm of private finance to meet basic needs, including housing, consumption, education, health, and provision for old age.
Such situations fuel inequality. According to (Kohler, Guschanski, and Stockhammer 2019):
Our main finding is that there are strong negative effects of financial liberalization and financial payments by non-financial corporations on the wage share. Rising household debt also reduces wage shares, albeit only in countries with a high share of mortgage debt among low-income earners combined with weak bargaining institutions. Taken together, the effects of financialization are of a similar order of magnitude. as the effects of globalization
4.4 Bargaining Power
The last but not least influential factor on the decline of labor share of income and thus raise of inequality is the undermined bargaining power of the labor.
Equality Trust states that:
The evidence on the link between union membership and inequality is relatively strong. Countries with a higher percentage of the labor force in unions have lower levels of inequality. (“What Influence Do Unions Have on Inequality?” 2015)
And also, we know from the data that workers who are union members earn more than non-union members:
In 2022, workers in the United Kingdom who were members of a trade union earned approximately 0.61 British pounds an hour more than workers who were not in a union. The largest difference during this period was in 2011, when members of unions earned 2.20 British pounds more per hour than non-members. (“UK Trade Union Members Earnings 2022” 2022)
According to (Atkinson 2015a):
There is general agreement that the widening of the pay distribution has coincided with a decline in the role of trade unions and collective bargaining.
Empirical studies, such as (Stockhammer 2013), find the decline in the bargaining power of the trade unions negatively affecting the wage share of the labor force.
It is important to underscore that the undermining of the trade unions has not simply been measured by the membership but also by their legal power and influence.
Atkinson (Atkinson 2015b) writes:
The decline in the influence of trade unions cannot be separated from the sustained period in the 1980s during which The Conservative government passed legislation limiting their activities. […] The end result of the legislation is that unions are considerably weakened in their legal status and protection.
5 Policy
Considering the fact that the major media outlets are controlled by the rich, it is expected to see strong resistance against any change towards a real pro-equality set of policies. Nevertheless, with proper framing, it is possible to disarm the pro-rich media and their arguments. The importance of meticulate framing cannot be overestimated. We are aware that seemingly innocent, pro-labor framing can backfire and work in favor of the rich. (Lakoff 2010)
It is important to emphasize that charity and philanthropy have been insufficient to alleviate rising inequality and especially to support the first income deciles. It is also part of the pro-rich rhetoric of the “society depends on the rich”.
It is important not to frame any taxation policy as a way of increasing government revenue. Such framing is not only institutionally wrong but also part of the aforesaid pro-rich rhetoric, which elevates the role of the rich as saviors of society. Such incorrect framing is in line with portraying the government as a weak entity that depends on the ultra-wealthy to be able to invest. We should frame the arguments from the perspective of market power, as the ultra-rich are now so wealthy that they can significantly influence or even buy elections, think-tanks, and politicians. We have all the evidence to demonstrate that taxing the rich is a pro-growth and pro-climate policy.
The incorrect framing of “the rich fund the government” will act as a public relations campaign for the rich, and any government investments will be credited to the rich, making them sort of heroes of society, while in reality they are more villains than heroes. It is against the dignity of teachers, nurses, and higher education staff to be told that your increased salary is funded by the ultra-rich. Such framing entrenched the myth of the ultra-rich’s role in society.
It is important to address and attack the anti-tax, pro-property argument in our framing. The claim that the rich are rich because they have worked for it and it is their money Any campaign should address this argument as well by highlighting the fact that the distribution of wealth is influenced by policy, not simply the ability of the players.
All in all, the first step seems to be making the public aware of the graveness of the income inequality situation and its implications while framing the argument with an emphasis on economic, political, social, and climate-wise evidence.
The augmenting part of the framing is presenting a set of policies to address the causes via leverage points. Since inequality is a multi-aspect phenomenon, the policy package must be multi-aspect as well.
Fiscal policy, including taxation and investment, is one versatile tool that we have in our toolkit; however, we should remember that the type of taxation matters. It seems that financialization has changed the main income source of the ultra-wealthy:
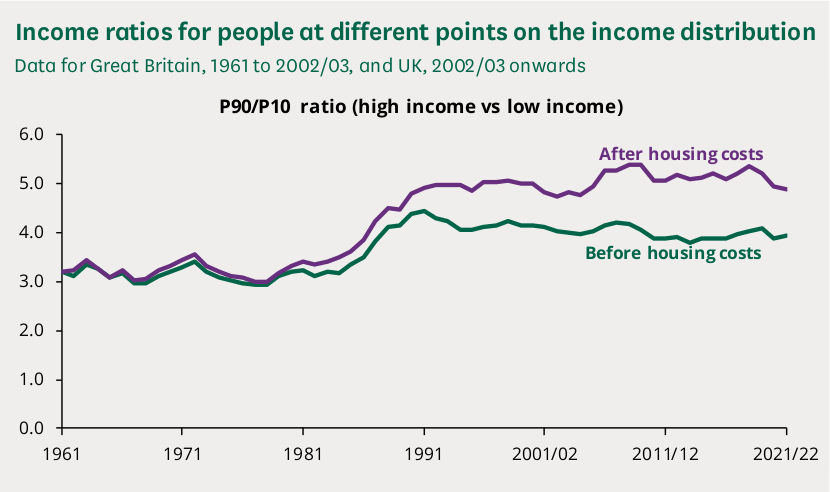
The gap between income inequality before and after shelter costs also suggests that public housing would be a successful policy to lower inequality.
Public investments in education, health, and transportation also probably play a significant role in reducing inequality. (Arestis 2021)
A revival of the trade unions can also improve the bargaining power of the labor force to earn a larger share of the income. (Mwamadzingo and Chinguwo 2015)
Just as important, if not more important than others, is the role of a job guarantee program to improve bargaining power and the low wages of low-skilled workers. (Atkinson 2015c) Such policy will also address the stagnancy of lower-tail wage inequality, pointed out by scholars such as (Machin 2011)
Ultimately, we should remember Goodhart’s law that “when a measure becomes a target, it ceases to be a good measure”. The Gini index should not be a mechanical target because it is possible to reduce the indicator’s value through scenarios with different implications. Figure 10 shows a reduction in the Gini in a scenario in which the middle class has become richer while the poor have remained poor.
